Page 31 - MVU Annual Report 2017/18
P. 31

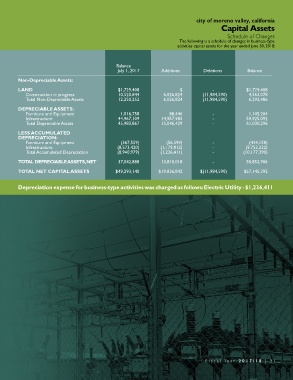
city of moreno valley, california
                                                                                             Capital Assets
                                                                                                Schedule of Changes
                                                                            The following is a schedule of changes in business-type
                                                                           activities capital assets for the year ended June 30, 2018:


                                                  Balance
                                                   July 1, 2017     Additions         Deletions         Balance
         Non-Depreciable Assets:

         LAND                                     $1,729,408                $             -             $1,729,408
            Construction in progress               10,520,844         6,026,824       (11,984,590)       4,563,078
            Total Non-Depreciable Assets           12,250,252         6,026,824       (11,984,590)       6,292,486

         DEPRECIABLE ASSETS:
            Furniture and Equipment                1,016,758            88,446            -              1,105,204
            Infrastructure                         44,967,109       14,957,983            -             59,925,092
            Total Depreciable Assets               45,983,867       15,046,429            -             61,030,296

         LESS ACCUMULATED
         DEPRECIATION:
            Furniture and Equipment                 (367,559)          (56,599)           -              (424,158)
            Infrastructure                        (8,573,420)       (1,179,812)           -             (9,753,232)
            Total Accumulated Depreciation        (8,940,979)       (1,236,411)           -            (10,177,390)
         TOTAL DEPRECIABLE ASSETS, NET             37,042,888       13,810,018            -             50,852,906

         TOTAL NET CAPITAL ASSETS                $49,293,140       $19,836,842       $(11,984,590)     $57,145,392


         Depreciation expense for business-type activities was charged as follows: Electric Utility - $1,236,411


                                                                                       Fiscal Y ear  2017/18   |  31
   26   27   28   29   30   31   32