
Page 30 - MVU Annual Report 2017/18
P. 30
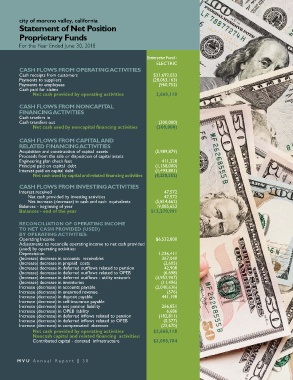
city of moreno valley, california
         Statement of Net Position
         Proprietary Funds

         For the Year Ended June 30, 2018

                                                               Enterprise Fund -
                                                                  ELECTRIC
         CASH FLOWS FROM OPERATING ACTIVITIES
         Cash receipts from customers                            $31,692,033
         Payments to suppliers                                   (28,063,163)
         Payments to employees                                     (960,752)
         Cash paid for claims
               Net cash provided by operating activities          2,668,118

         CASH FLOWS FROM NONCAPITAL
         FINANCING ACTIVITIES
         Cash tranfers in
         Cash transfers out                                         (300,000)
               Net cash used by noncapital financing activities    (300,000)


         CASH FLOWS FROM CAPITAL AND
         RELATED FINANCING ACTIVITIES
         Acquisition and construction of capital  assets          (5,989,879)
         Proceeds from the sale or disposition of capital assets
         Engineering plan check fees                                 411,328
         Principal paid on capital  debt                          (1,158,000)
         Interest paid on capital debt                            (1,493,801)
               Net cash used by capital and related financing activities   (8,230,352)

         CASH FLOWS FROM INVESTING ACTIVITIES
         Interest received                                            47,572
             Net cash provided by investing activities                47,572
             Net increase (decrease) in cash and cash  equivalents   (5,814,662)
         Balances - beginning of year                              19,085,653
         Balances - end of the year                             $13,270,991


         RECONCILIATION OF OPERATING INCOME
         TO NET CASH PROVIDED (USED)
         BY OPERATING ACTIVITIES:
         Operating Income                                         $6,532,800
         Adjustments to reconcile operating income to net cash provided
         (used) by operating activities:
         Depreciation                                              1,236,411
         (Increase) decrease in accounts  receivables                367,040
         (Increase) decrease in prepaid  costs                       (2,605)
         (Increase) decrease in deferred outflows related to pension   42,908
         (Increase) decrease in deferred outflows related to OPEB    (6,698)
         (Increase) decrease in deferred outflows - utility network   (3,952,907)
         (Increase) decrease in inventories                         (11,496)
         Increase (decrease) in accounts payable                  (2,040,636)
         Increase (decrease) in unearned revenue                       (576)
         Increase (decrease) in deposit payable                      441,198
         Increase (decrease) in self-insurance payable
         Increase (decrease) in net pension liability                266,851
         Increase (decrease) in OPEB liability                         6,686
         Increase (decrease) in deferred inflows related to pension   (182,811)
         Increase (decrease) in deferred inflows related to OPEB     (5,377)
         Increase (decrease) in compensated  absences                (22,670)
               Net cash provided by operating activities         $2,668,118
               Noncash capital and related financing  activities:
               Contributed capital - donated  infrastructure     $3,098,784


        MVU  Ann ual  Repor t  |  30