
Page 9 - Moreno Valley 2025 Citizens Guide to the Budget
P. 9
BUDGET AT A
GET INVOLVED GLANCE
The City’s Budget consists of three major components: General Fund Budget (general operations), Capital Improvement
Program (CIP) Budget, and other special/restricted fund budgets.
The General Fund Budget is the City’s fiscal operating blueprint. The FY 2025/26 & 2026/27 General Fund budget is based
on resource/revenue projections of $204.2 million and $213.4 million, respectively. Departmental operating expenditures are
budgeted at $204.2 million and $213.4 million, respectively.
The FY 2025/26 & 2026/27 budget furthers the City’s ongoing commitment to fiscal responsibility and effective management.
The budget is balanced without the use of contingency reserve funding and concentrates resources on maintaining the
existing levels of services and public safety.
FY 2024/25 FY 2025/26 FY 202 /2
General Fund Amended Budget Adopted Budget Adopted Budget
Revenues $16 , ,1 $204,173,791 $213,416,086
Expenses $161, 44,48 $204,166,791 $213,409,086
Variance $(64 , ) $7,000 $7,000
GENERAL FUND SUMMARY
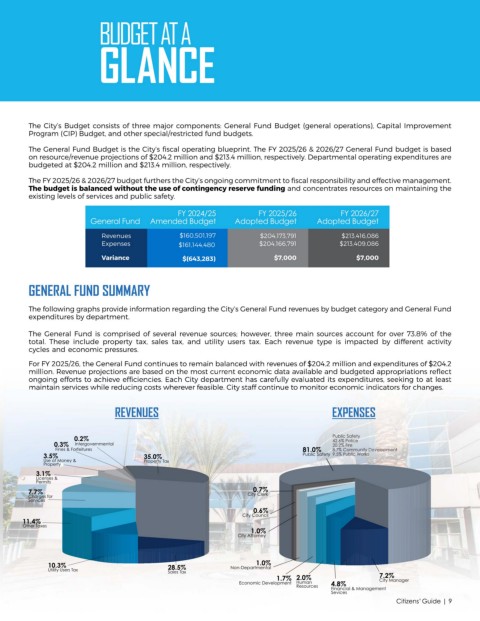
The following graphs provide information regarding the City’s General Fund revenues by budget category and General Fund
expenditures by department.
The General Fund is comprised of several revenue sources; however, three main sources account for over 7 .8% of the
total. These include property tax, sales tax, and utility users tax. Each revenue type is impacted by different activity
cycles and economic pressures.
For FY 2025/26, the General Fund continues to remain balanced with revenues of $204.2 million and expenditures of $204.2
For FY 2025/26, the General Fund continues to remain balanced with revenues of $204.2 million and expenditures of $204.2
million. Revenue projections are based on the most current economic data available and budgeted appropriations reflect
million. Revenue projections are based on the most current economic data available and budgeted appropriations reflect
ongoing efforts to achieve efficiencies. Each City department has carefully evaluated its expenditures, seeking to at least
ongoing efforts to achieve efficiencies. Each City department has carefully evaluated its expenditures, seeking to at least
maintain services while reducing costs wherever feasible. City staff continue to monitor economic indicators for changes.
maintain services while reducing costs wherever feasible. City staff continue to monitor economic indicators for changes.
REVENUES EXPENSES
0. % Public Safety
4 . % Police
0. te e e t . % Fire
Fines & Forfeitures 81.0% . % Community Development
3. % 3 .0% Public Safety 9. % Public Works
Use of Money & Property Tax
Property
3. %
Licenses &
Permits
7.7% 0.7%
Charges for City Clerk
Services
0.6%
City Council
1 . %
Other Taxes
1.0%
City Attorney
1.0%
0. % 2 . % Non-Departmental
Utility Users Tax
Sales Tax
1.7% 2.0% 7.2%
City Manager
Economic Development Human 4.8%
Resources
Financial & Management
Sevices
Citizens’ Guide | 9