Page 13 - Moreno Valley 2025 Citizens Guide to the Budget
        P. 13
     EXPENSES
        CITY STAFFING
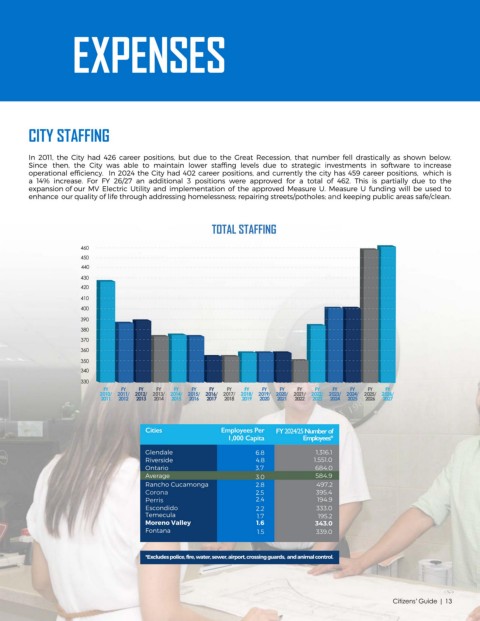
        In 2011, the City had 426 career positions, but due to the Great Recession, that number fell drastically as shown below.
        Since then, the City was able to maintain lower staffing levels due to strategic investments in software to increase
        operational efficiency.  In 2024 the City had 402 career positions, and currently the city has 459 career positions,  which is
        a 14% increase. For FY 26/27 an additional   positions were approved for a total of 462. This is partially due to the
        expansion of our MV Electric Utility and implementation of the approved Measure U. Measure U funding will be used to
        enhance our quality of life through addressing homelessness; repairing streets/potholes;     keeping public areas safe/clean.
                                                       TOTAL STAFFING
                     460
                     450
                      440
                     430
                     420
                     410
                     400
                     390
                     380
                     370
                     360
                     350
                     340
                     330
                           FY   FY  FY   FY  FY   FY  FY   FY  FY   FY  FY   FY  FY   FY  FY   FY  FY
                          2010/  2011/  2012/  2013/  2014/  2015/  2016/  2017/  2018/  2019/  2020/  2021/  2022/  2023/  2024/  2025/  2026/
                           2011  2012  2013  2014  2015  2016  2017  2018  2019  2020  2021  2022  2023  2024  2025  2026  2027
                                      Cities             Employees Per  FY 2024/25Numberof
                                                           1,000 Capita       Employees*
                                      Glendale                    6.8             1,3  .
                                      Riverside                   4.8            1,   .
                                      Ontario                     3.              84.0
                                      Average                      .              84.
                                      Rancho Cucamonga            2.8             4  .2
                                                                  2.                 .4
                                                                  2.4               4.
                                       scondido                   2.2                .
                                      Temecula                     1.                .2
                                      Moreno Valley               1.6               .
                                      Fontana                      1.                .
                                      *Excludes police, fire, water, sewer, airport, crossing guards,  and animal control.
                                                                                                     Citizens’ Guide | 13


