Page 12 - Moreno Valley Citizen's Guide to the Budget
P. 12

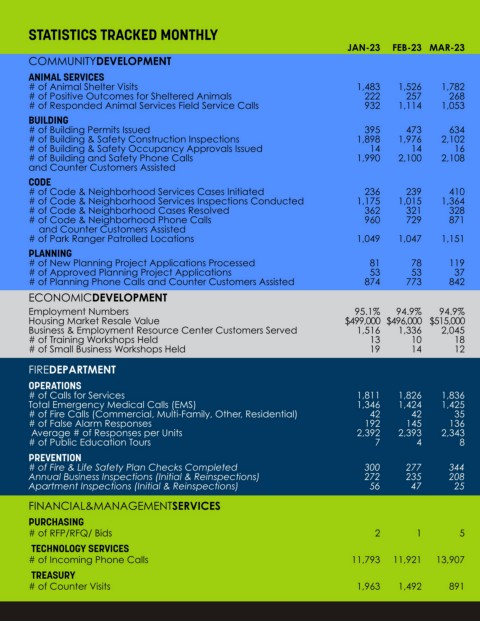
STATISTICS TRACKED MONTHLY

                                                                                          JAN-23     FEB-23 MAR-23            APR-23 MAY-23         JUN-23     JUL-23 AUG-23         SEP-23 OCT-23 NOV-23 DEC-23                 TOTAL
        COMMUNITYDEVELOPMENT
        ANIMAL SERVICES
        # of Animal Shelter Visits                                                           1,483     1,526      1,782         1,596       1,860     1,752      1,597      1,581      1,488     1,203      1,326      1,618   18,812
        # of Positive Outcomes for Sheltered Animals                                            222      257        268           260         264       292        273        265        281       257        256        281      3,176
        # of Responded Animal Services Field Service Calls                                     932     1,114      1,053         1,079       1,092       983        922        865        938       957        840        750   11,525
        BUILDING
        # of Building Permits Issued                                                           395       473        634           554         671       579        512        454      1,870       519        511        383      7,555
        # of Building & Safety Construction Inspections                                      1,898     1,976      2,102         2,352       2,535     2,520      2,285      2,257      1,870     2,131      2,171      2,100   26,197
        # of Building & Safety Occupancy Approvals Issued                                        14       14         16             21         10          8        20         33          2         32         15        19        204
        # of Building and Safety Phone Calls                                                 1,990     2,100      2,108           873         647       636        879      1,396        993     1,311      1,134        937   15,004
        and Counter Customers Assisted
        CODE
        # of Code & Neighborhood Services Cases Initiated                                      236       239        410           358         335       305        495        500        462       556        534        340      4,770
        # of Code & Neighborhood Services Inspections Conducted                              1,175     1,015      1,364         1,292       1,153     1,016      1,464      1,986      1,610     1,917      1,837      1,354   17,183
        # of Code & Neighborhood Cases Resolved                                                362       321        328           292         289       227        392        400        407       504        465        359      4,346
        # of Code & Neighborhood Phone Calls                                                   960       729        871           739         820       850        865      1,115      1,050     1,207        821        782   10,809
           and Counter Customers Assisted
        # of Park Ranger Patrolled Locations                                                1,049      1,047      1,151         1,191       1,453     1,480      1,592      1,578      1,585     1,681      1,444      1,867   17,118
        PLANNING
        # of New Planning Project Applications Processed                                        81        78        119             95         94         98        90         97         74       107          64        64      1,061
        # of Approved Planning Project Applications                                             53        53         37             57         49         52        67         47         37         49         28        39        568
        # of Planning Phone Calls and Counter Customers Assisted                               874       773        842           812         701       665        606        993        835       821        758        606      9,286
        ECONOMICDEVELOPMENT

        Employment Numbers                                                                  95.1%     94.9%      94.9%         95.4%       95.2%     94.5%      94.8%      94.6%      94.8%     94.7%      94.7%      94.7%      94.9%
        Housing Market Resale Value                                                        $499,000   $496,000   $515,000    $511,100   $545,000   $532,000   $558,000   $550,000   $539,000   $545,000   $530,000   $540,000   $530,008
        Business & Employment Resource Center Customers Served                                1,516    1,336      2,045         1,892       2,579     1,924      2,052      1,922      3,010     2,465      2,183      1,582   24,506
        # of Training Workshops Held                                                             13       10         18             16         20         11        19         16         21         13         19        16        192
        # of Small Business Workshops Held                                                       19       14         12             21         10         24        16         22         31         22         23        15        229

        FIREDEPARTMENT
        OPERATIONS
        # of Calls for Services                                                              1,811     1,826      1,836         1,867       1,793     1,796      2,002      1,984      1,826     1,988      1,883      2,034   22,646
        Total Emergency Medical Calls (EMS)                                                  1,346     1,424      1,425         1,459       1,393     1,393      1,518      1,547      1,437     1,490      1,464      1,591   17,487
        # of Fire Calls (Commercial, Multi-Family, Other, Residential)                          42        42         35             46         42         59        97         37         40         49         47        47        583
        # of False Alarm Responses                                                             192       145        136           136         146       130        136        171        158       195        168        160      1,873
         Average # of Responses per Units                                                    2,392     2,393      2,343         2,327       2,321     2,438      2,713      2,602      2,447     2,649      2,306      2,623   29,554
        # of Public Education Tours                                                               7         4          8            11         18         10          5         8          9         17          9        13        119
        PREVENTION
        # of Fire & Life Safety Plan Checks Completed                                          300       277        344           213         329       290        202        259        210       256        215        176      3,071
        Annual Business Inspections (Initial & Reinspections)                                  272       235        208             72        182       182        126        190        209       160        193        147      2,176
        Apartment Inspections (Initial & Reinspections)                                          56       47         25             71        134         55        44         27         42         93         82        82        758

        FINANCIAL&MANAGEMENTSERVICES
        PURCHASING
        # of RFP/RFQ/ Bids                                                                        2         1          5             3          1          2          -         7          5          3          5          4        38
         TECHNOLOGY SERVICES
        # of Incoming Phone Calls                                                           11,793   11,921   13,907           12,017     13,739   12,462   12,005   13,892   11,885   12,702   10,693                 9,718   146,734

         TREASURY
        # of Counter Visits                                                                  1,963     1,492        891           583         796       743        791        847        653       811        856        781   11,207
   7   8   9   10   11   12   13   14   15   16